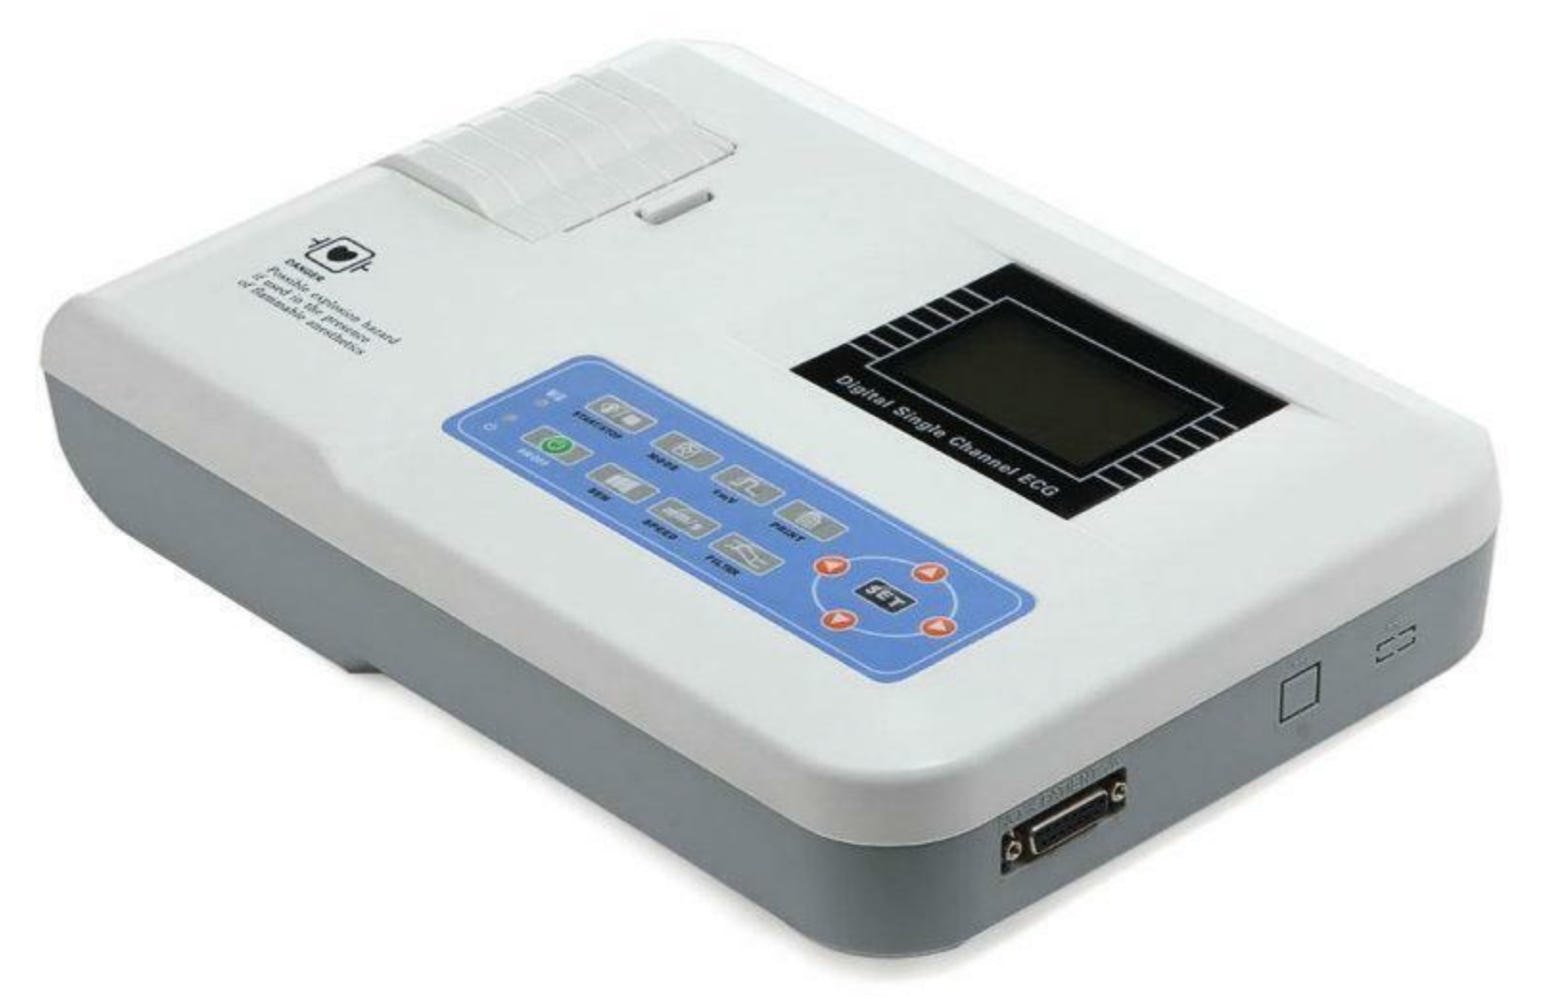
The EKG machine must be properly set up to ensure that the EKG is accurate and free from interference or distortion, known as artifact.
The EKG machine should be placed close to the patient during the testing to avoid tension on lead wires or electrodes. Some machines are attached to rolling carts and other have handles so they can be carried.
Smaller machines can be placed on a bedside or overbed table.
The EKG Technician must adjust the bed or exam table to a proper working height, between waist and hip high, so he can easily reach the patient.
Concept of EKG acquisition:
The EKG is a sophisticated tool that measures very low differences in electrical energy traveling across the surface of the human body.
Using special electrodes, the EKG machine records changes on graph paper. The EKG is a graphic representation of changes in energy over time. Many diseases of the heart result in specific changes that can be traced by the EKG machine.
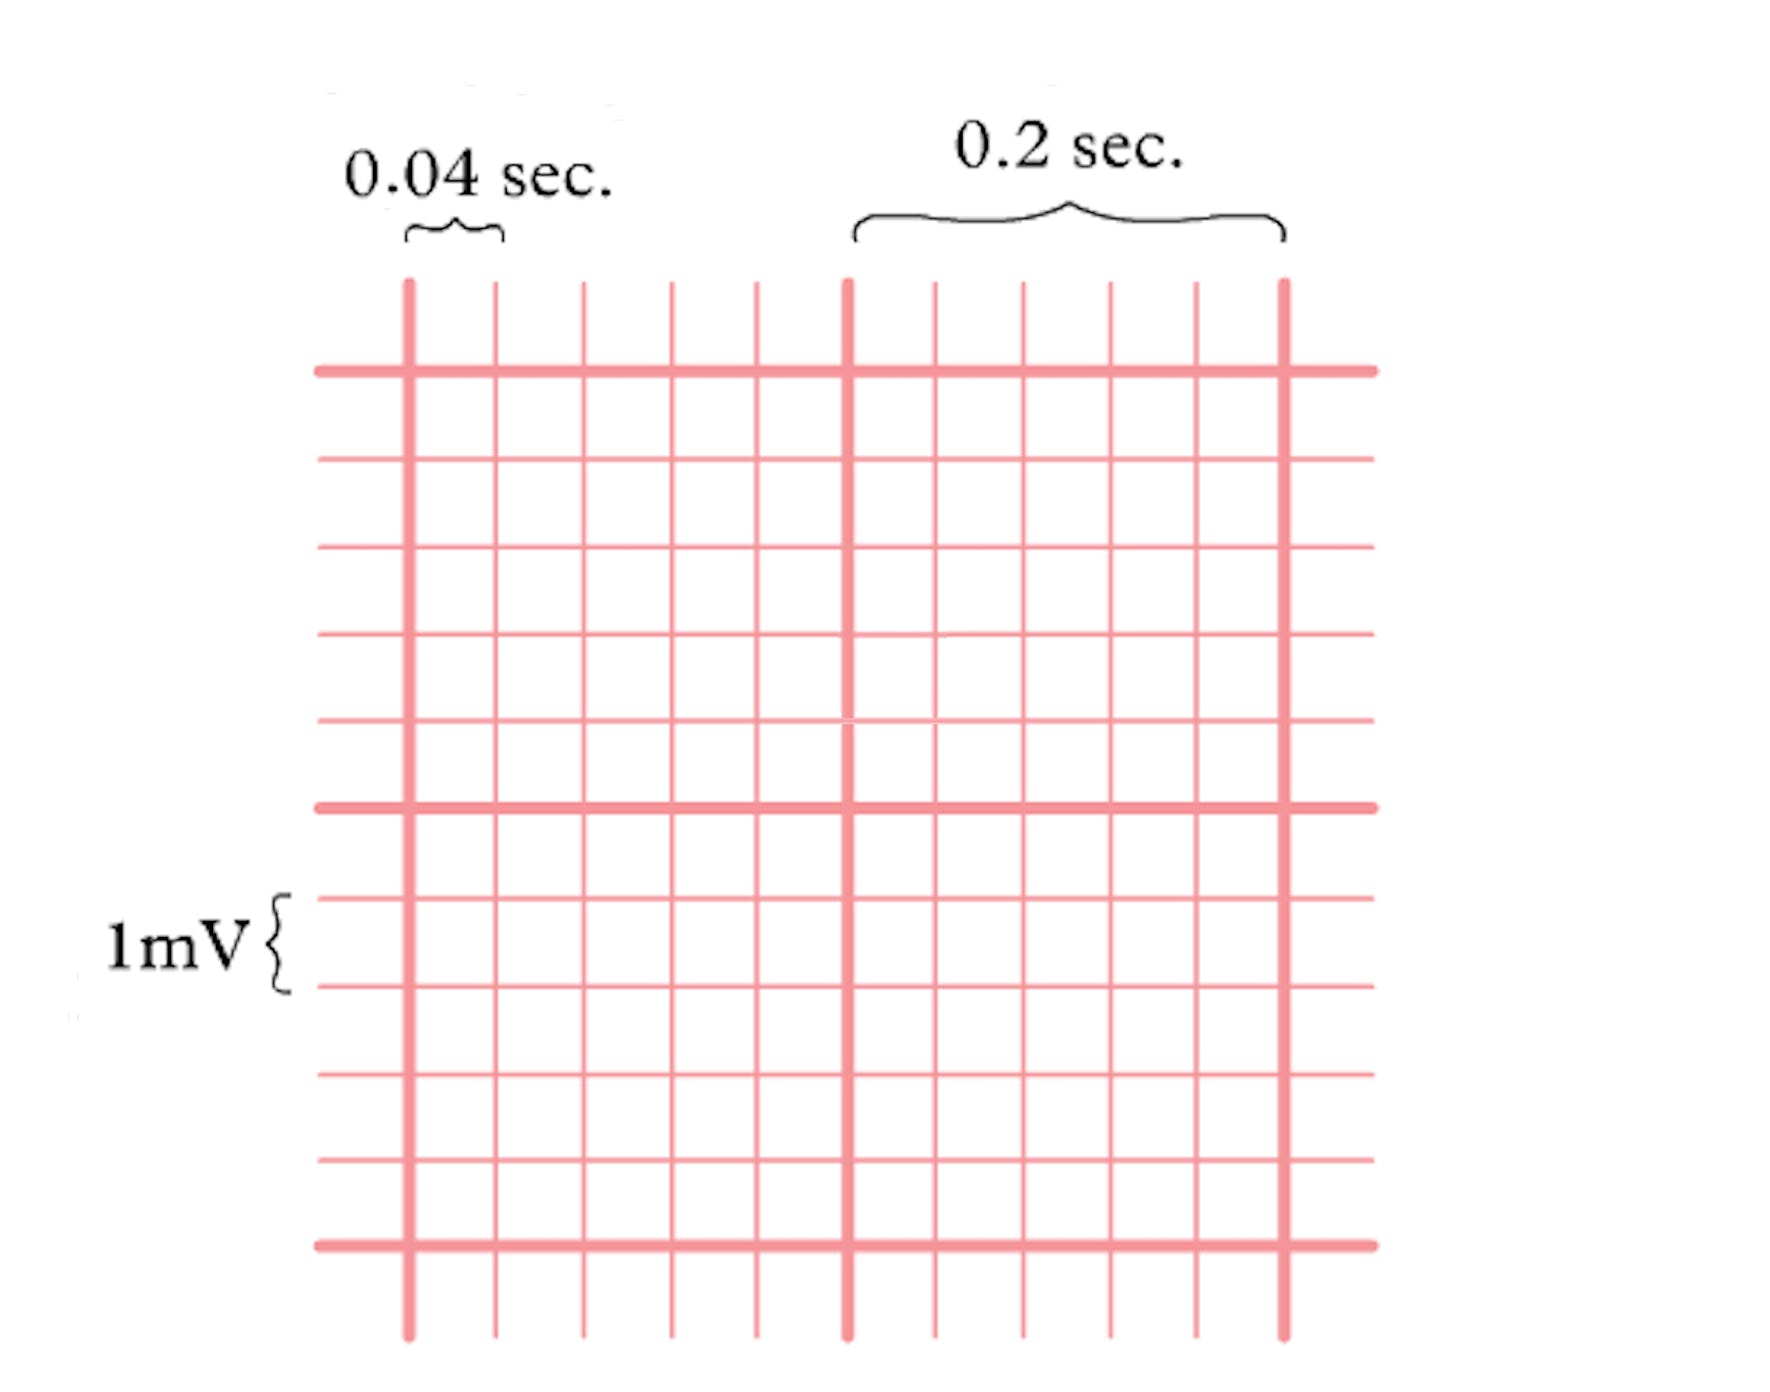
Standard grid:
Standard EKG paper contains small boxes that measure 1 millimeter (mm) tall by 1 mm wide.
Five small boxes make up a larger box on the EKG paper.
Thicker gridlines indicate 5 mm boxes.
Each 1mm box going up represents 0.1 millivolt (mV).
Each 1mm box going to the right represents 0.04 seconds.
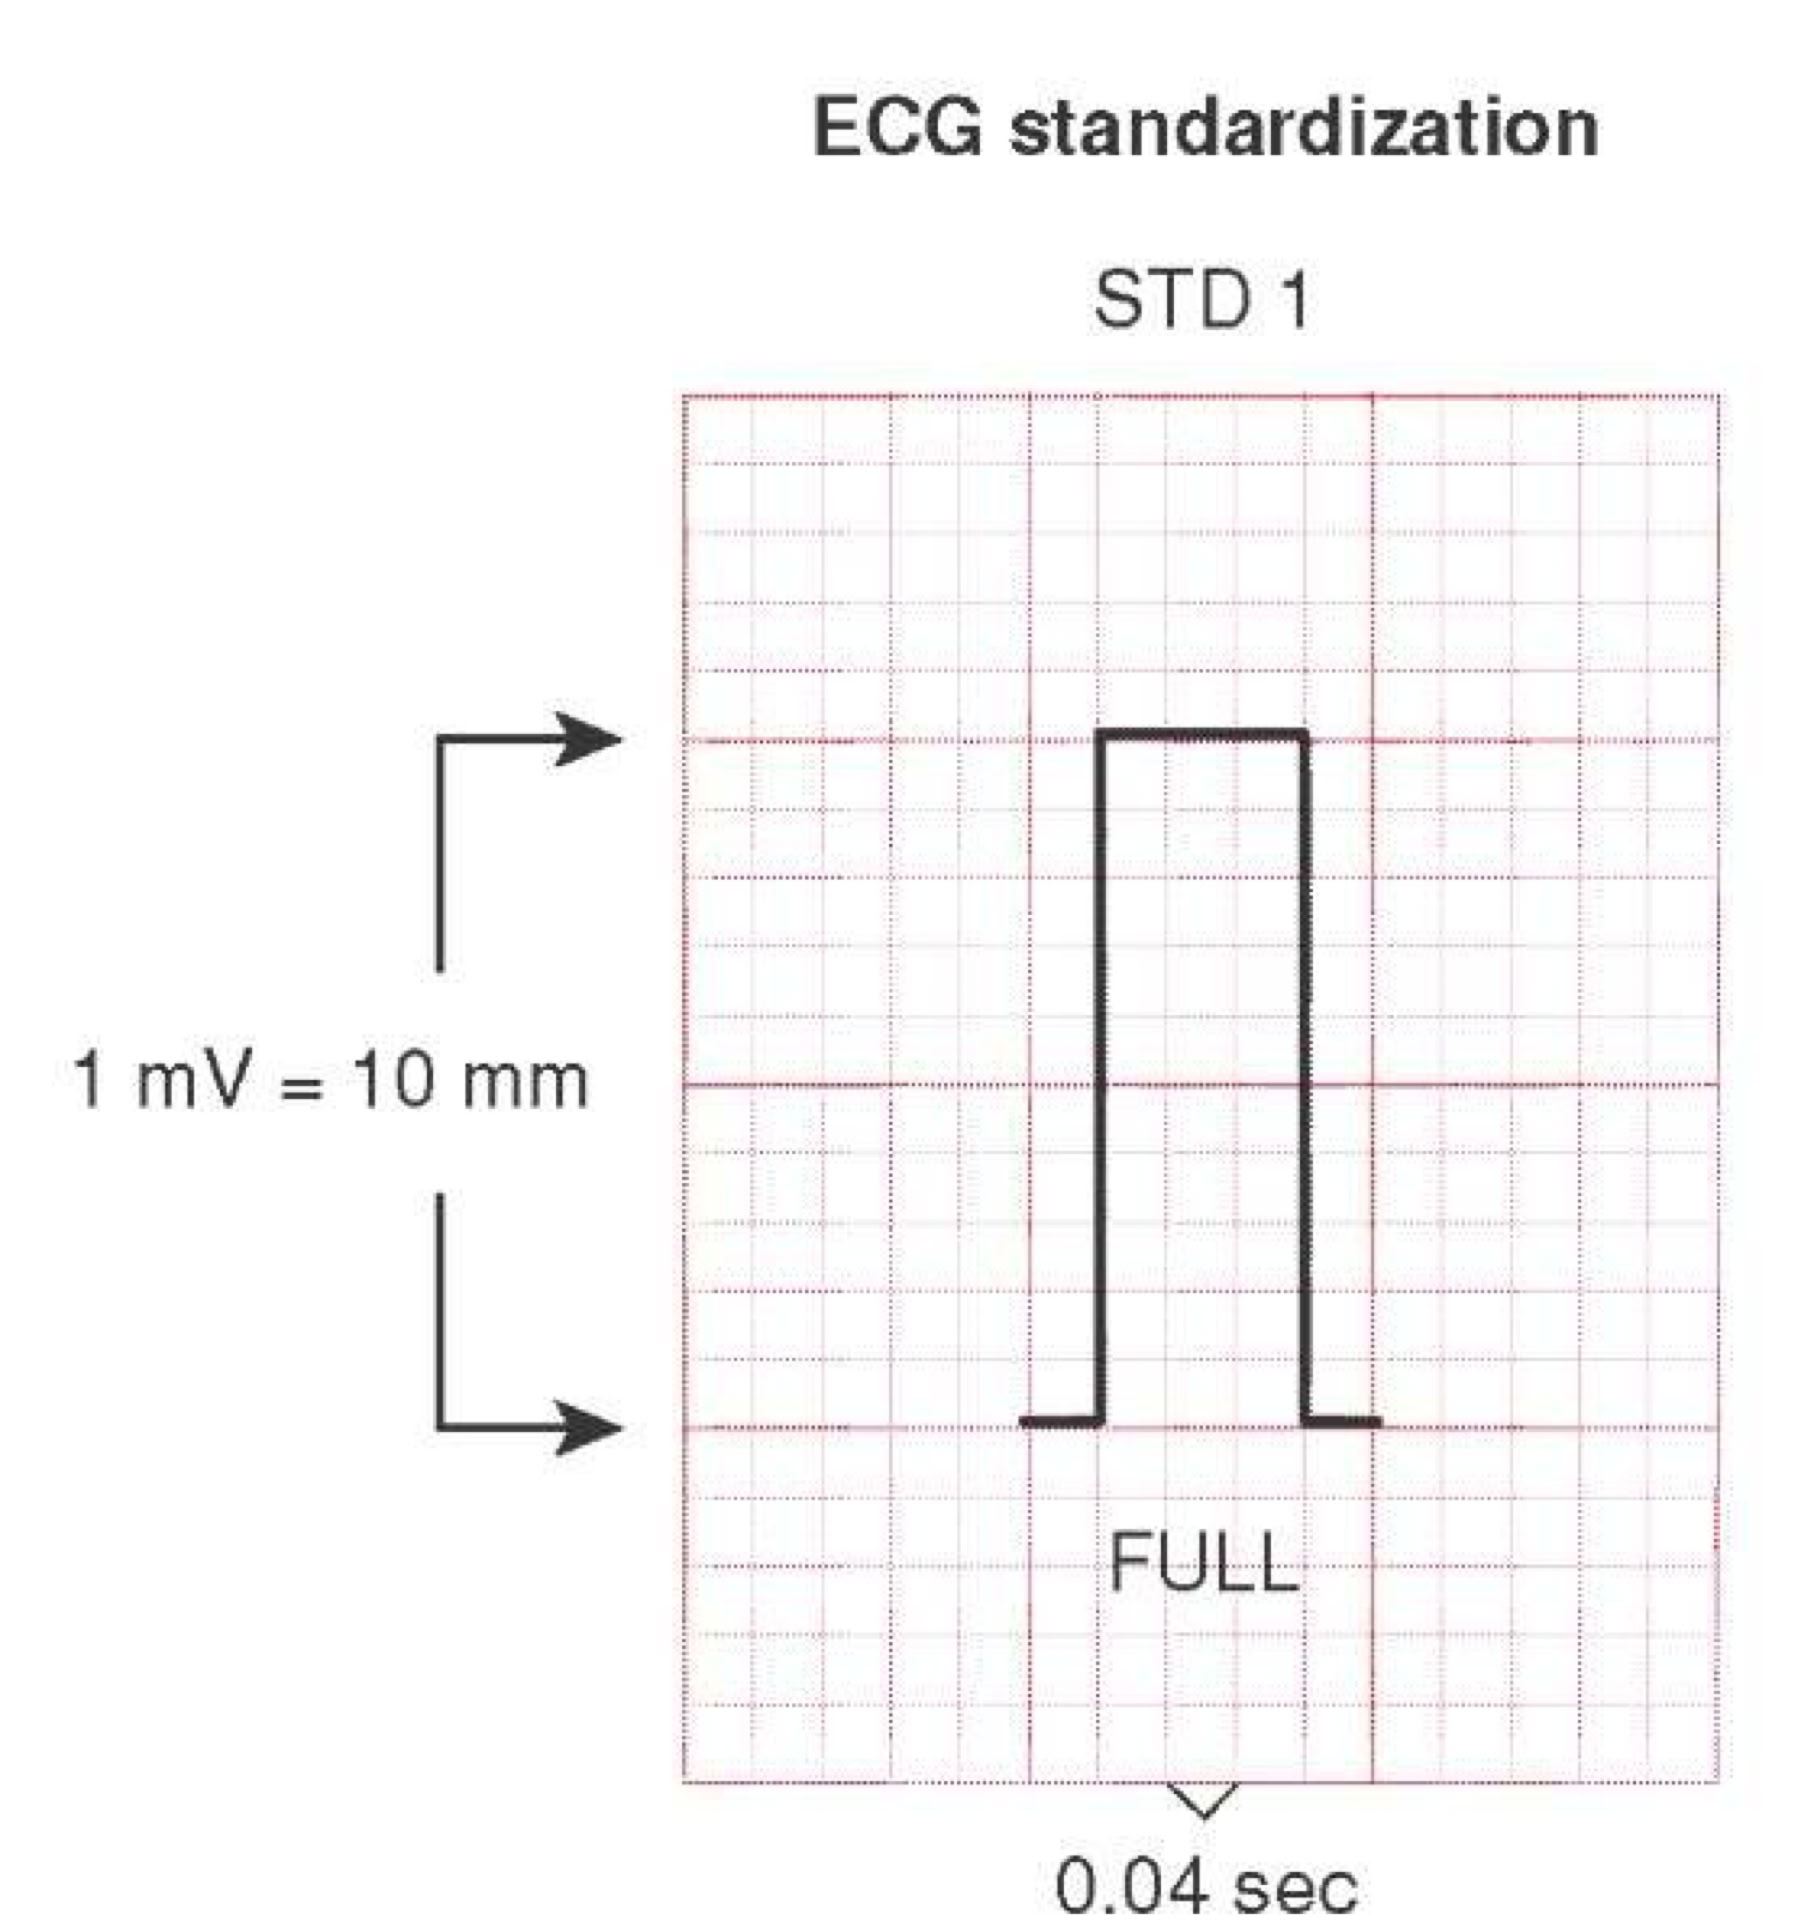
Gain control:
The gain control on an EKG machine can be used to change the sensitivity of the machine.
Gain is a measurement of how high or low the stylus (the part of the machine that makes the marks on the paper) will move in response to the heart electrical signals.
Standard gain, or default gain setting for an EKG machine, is 10mm/mv.
This means that one-millivolt electrical signal will produce a mark on the EKG tracing that measures 10 millimeters.
The EKG tracing includes a calibration marker that looks like a vertical rectangle with the bottom line missing. When the machine is operated at default speed and with standard gain, the mark should be 5 millimeters wide by 10 millimeters tall.
Paper Speed:
Standard paper speed is 25 mm/second. Paper speed can be changed to facilitate interpretation of the EKG tracing in certain cases.
By increasing the paper speed to 50 mm/second, the EKG appears to expand and waves that were previously "bunched" together become more clearly visible.
Paper speed should never be changed without a physician's order. Improper paper speed can result in improper arrhythmia interpretation.
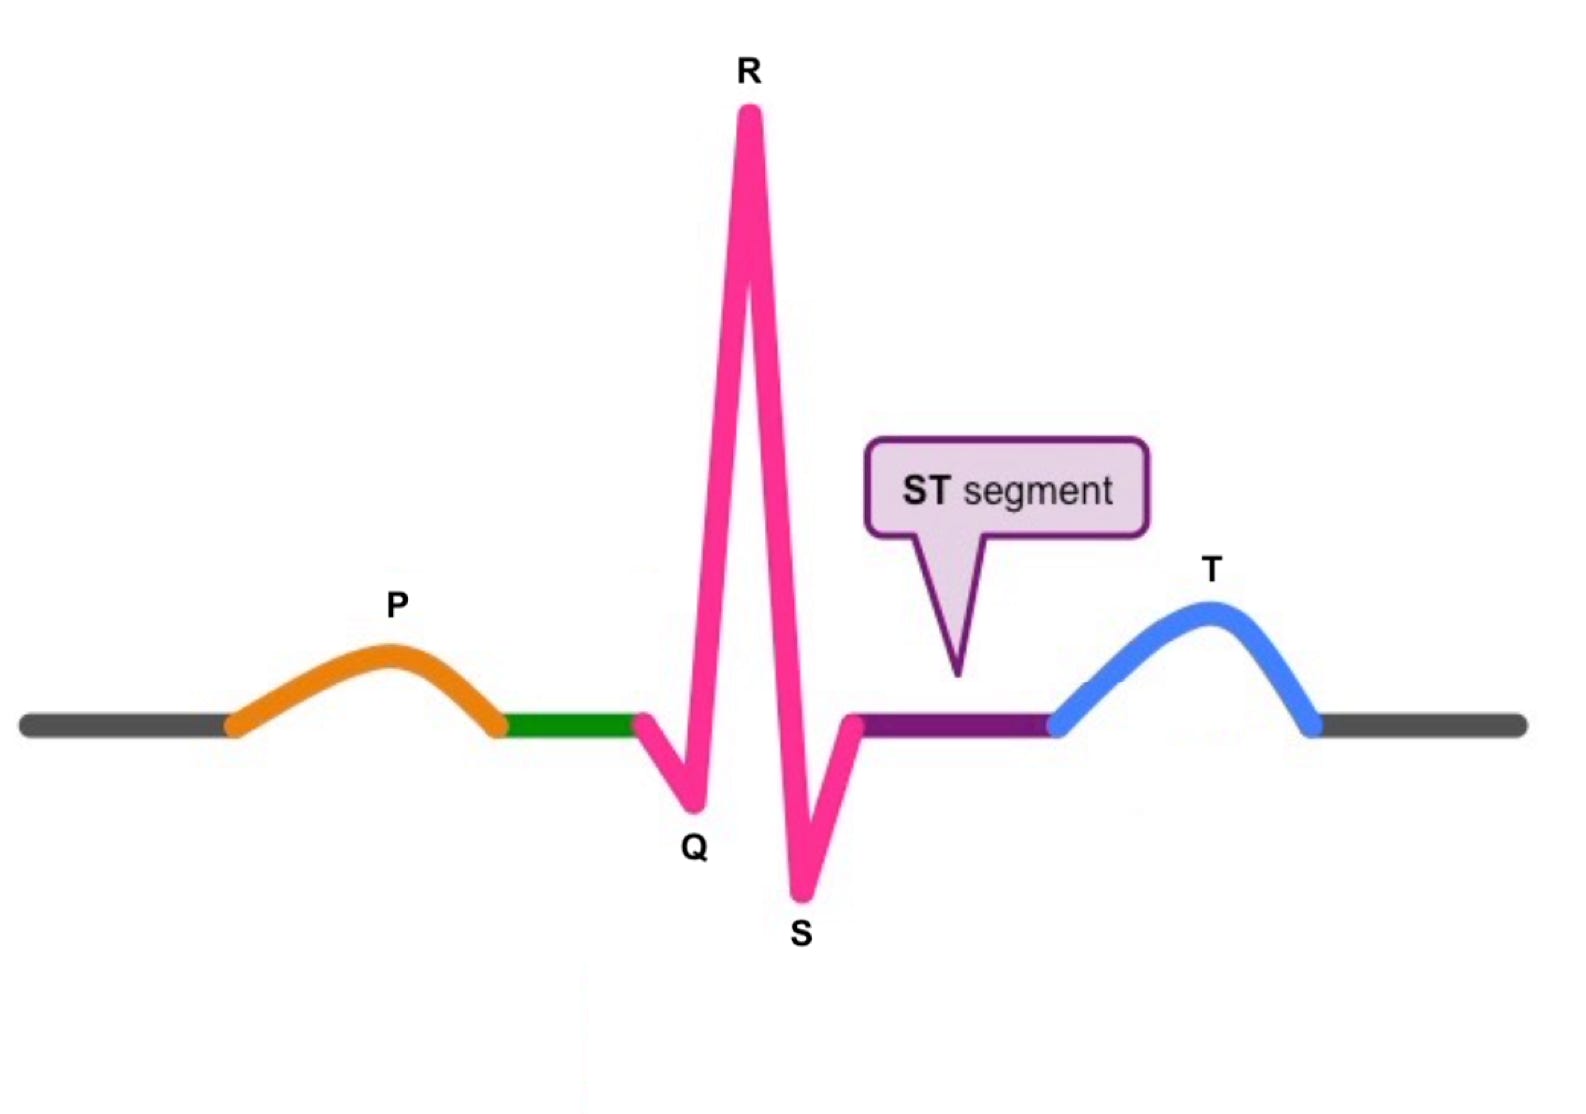
EKG Waves:
The first step in understanding how to read an EKG tracing is to understand the basic EKG.
The isoelectric line (baseline) is the straight line in the EKG and is called the rest phase.
The upward and downward movements are called waves.
A deflection, or upward movement from the isoelectric line is a positive wave.
A deflection, or downward movement from the isoelectric line is a negative wave.
The area between two waves is called a segment.
A wave and a segment taken together form an interval.
Several waves together are called complex.
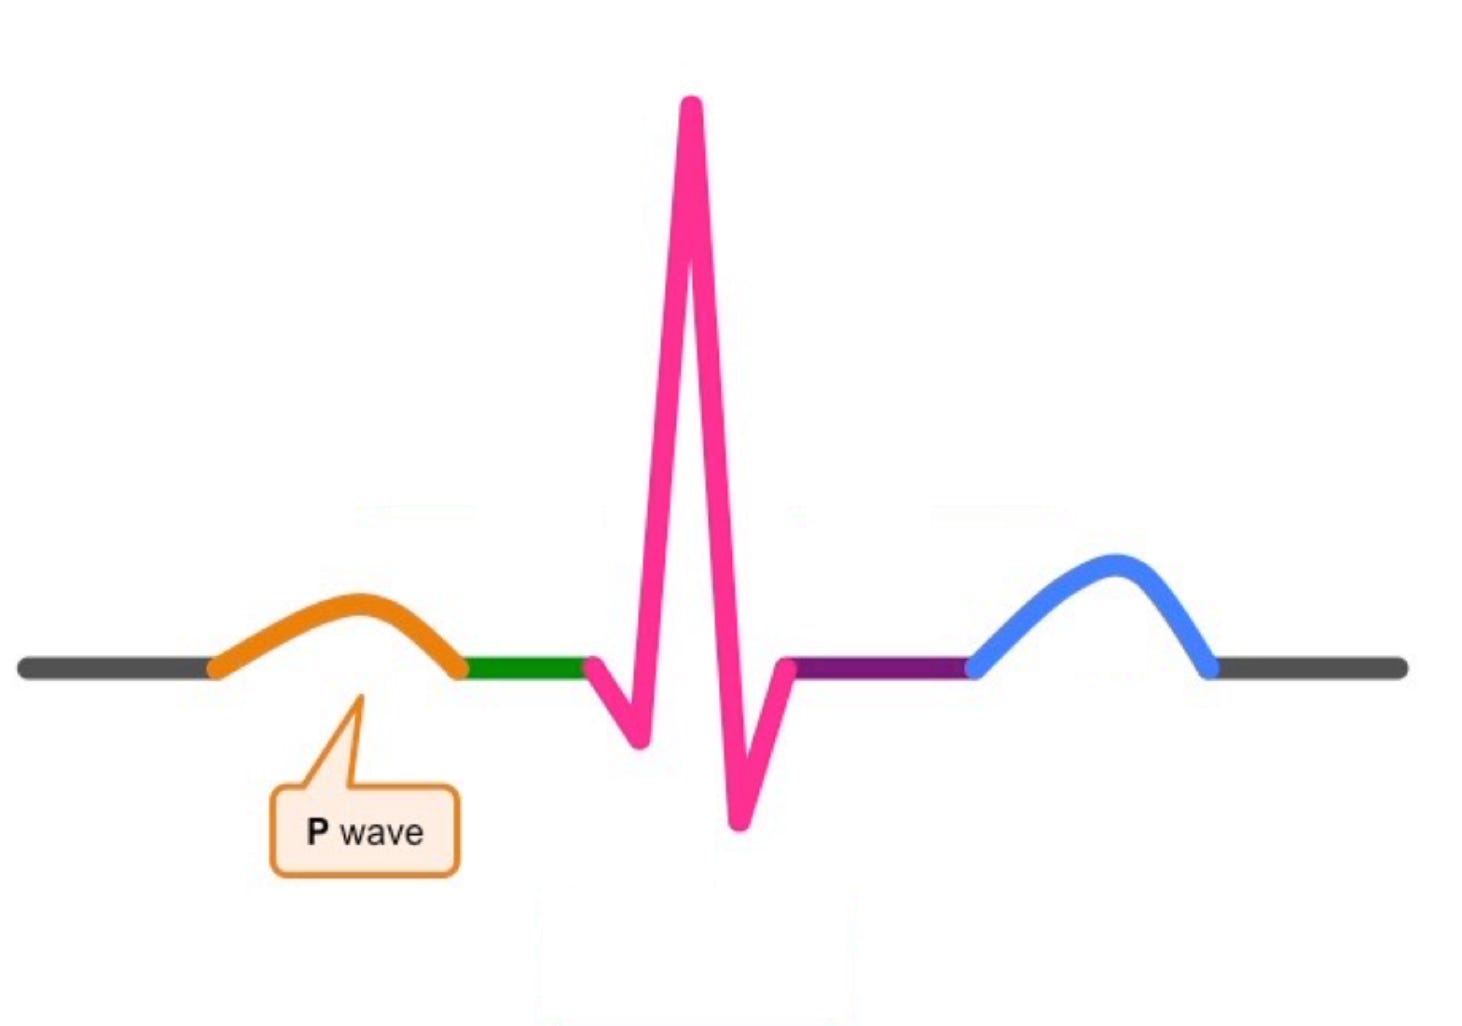
The P wave:
The P wave is the first positive deflection, or upward movement, in the complex, and it represents atrial depolarization (contraction of the atria).
Begins when the SA node fires, a normal p wave ranges is less than 0.10 sec.
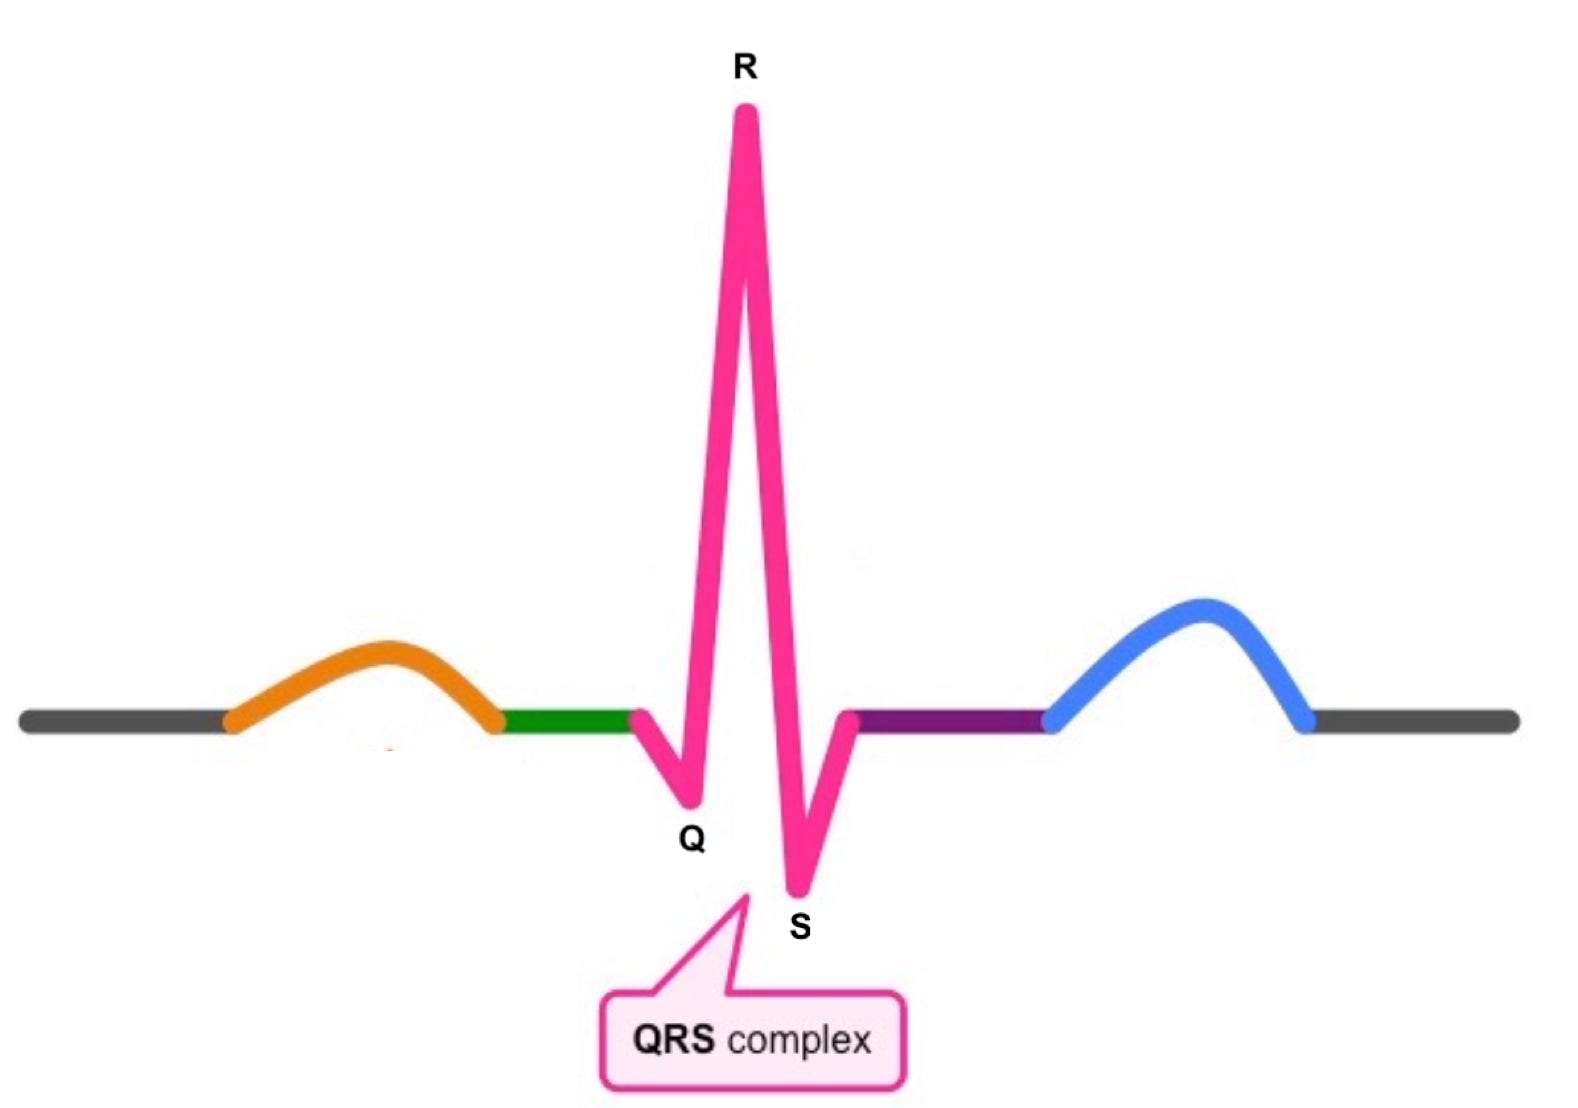
The QRS complex:
The QRS complex is composed of three waves:
The Q wave is the first negative deflection (downward movement) after the P wave.
The R wave is the next positive deflection (upward movement).
Finally the S wave is the next negative deflection (downward movement).
The QRS complex represents ventricular depolarization and the contraction of the ventricles.
The height of each QRS complex should be evaluated for uniformity. The normal QRS complex ranges from 0.04 to 0.10 seconds.
QRS Interval: measures from where the Q wave first leaves the isoelectric line to where the S wave returns to the Isoelectric line.
Normal QRS interval is less than 0.12sec.
Q-T interval represents one complete ventricular cycle.
It is measured from the beginning of the Q wave to the end of the T wave.
A Q-T interval should not be longer than 0.44sec.
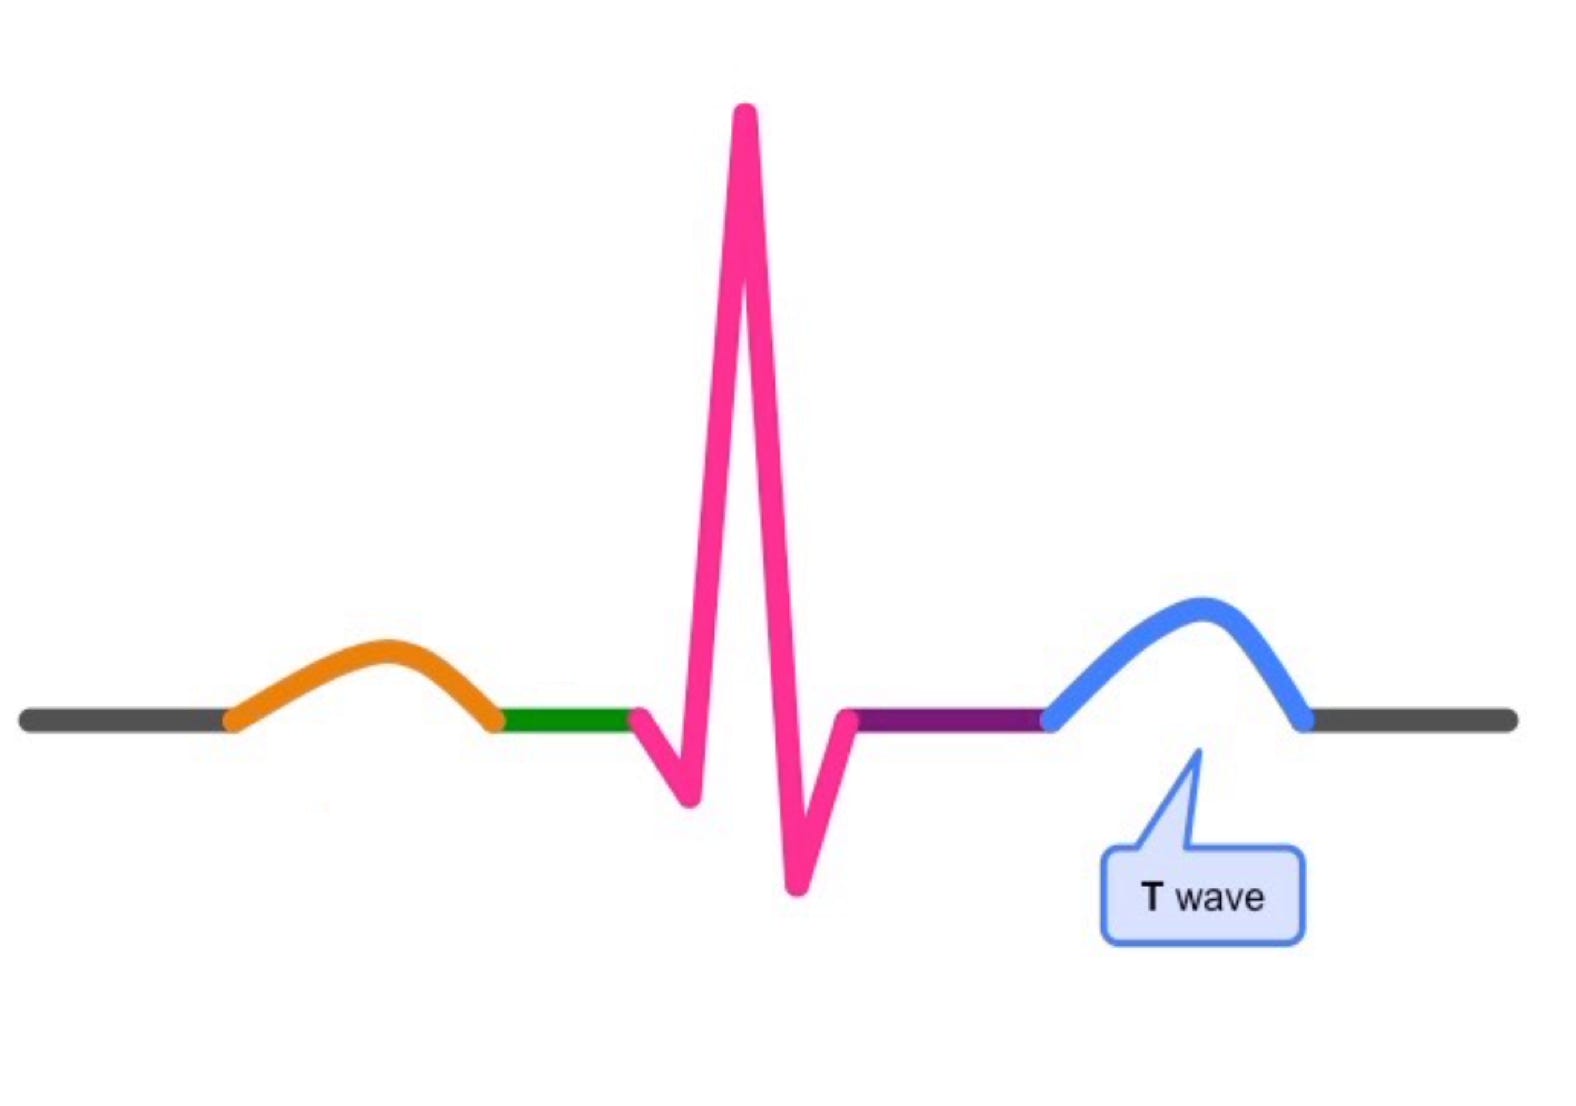
The T wave:
The T wave follows the QRS complex and indicates ventricular repolarization (resting of the ventricles).
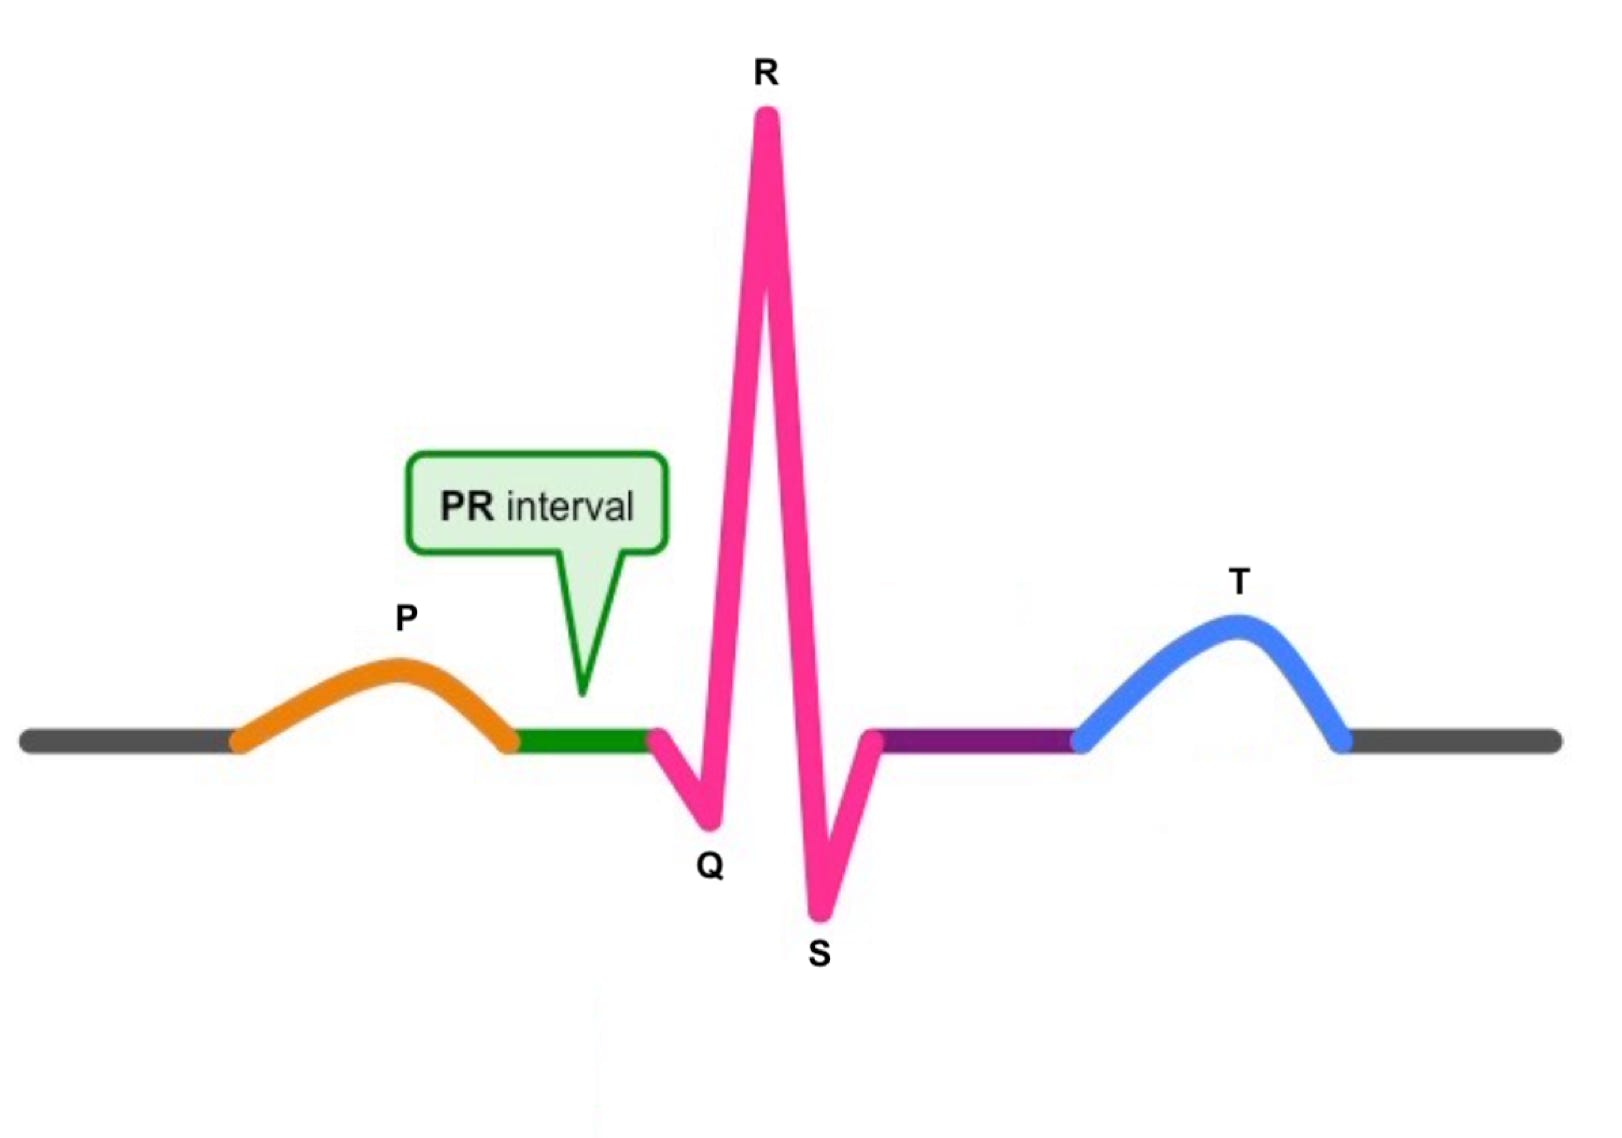
P-R interval:
The P-R interval represents the time from the beginning of the atrial depolarization to the beginning of ventricular depolarization.
It starts a at the beginning of the P wave and ends at the beginning of the Q wave.
The normal P-R interval ranges from 0.12 to 0.20 seconds.
S-T Segment:
The S-T segment represents the early phase of ventricular repolarization (resting phase).
It starts at the end of the S wave and ends at the beginning of the T wave.
It represents the time from the end of ventricular depolarization to the beginning of ventricular repolarization.
A normal S-T segment should stay at baseline, not deviating above or below. Elevated S-T segment can indicate Myocardial Infarction.
Calculate a patient's heart rate from the EKG tracing:
Heart rate can be measured from the EKG using a variety of different approaches. The following are the most commonly employed methods.
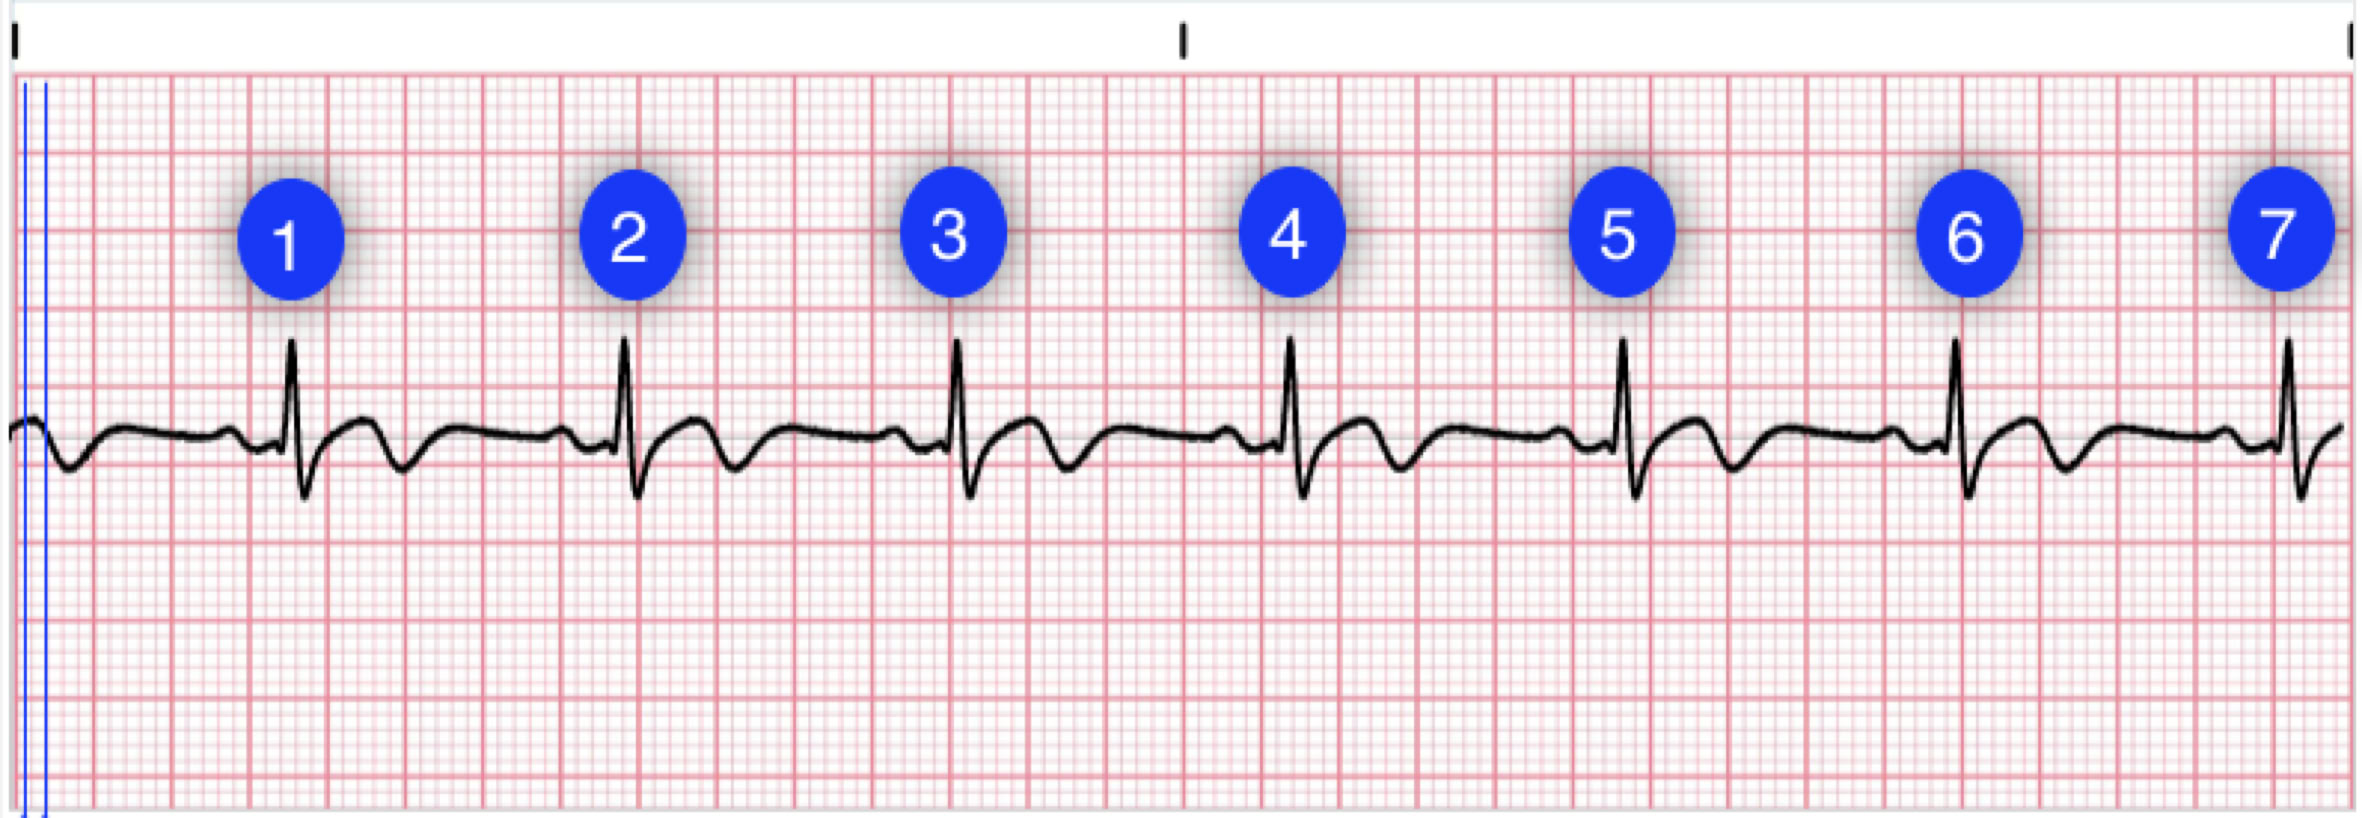
6-second rule:
The 6-second rule is simple and works well in estimating the rate of an irregular rhythm.
At the top of the tracing, there are small hash marks indicating 3-second intervals. Count the number of QRS complexes in two of the sections (6-second period) and multiply by 10.
For example, you count 7 QRS complexes in 6 seconds. 7 X 10 = 70/min.
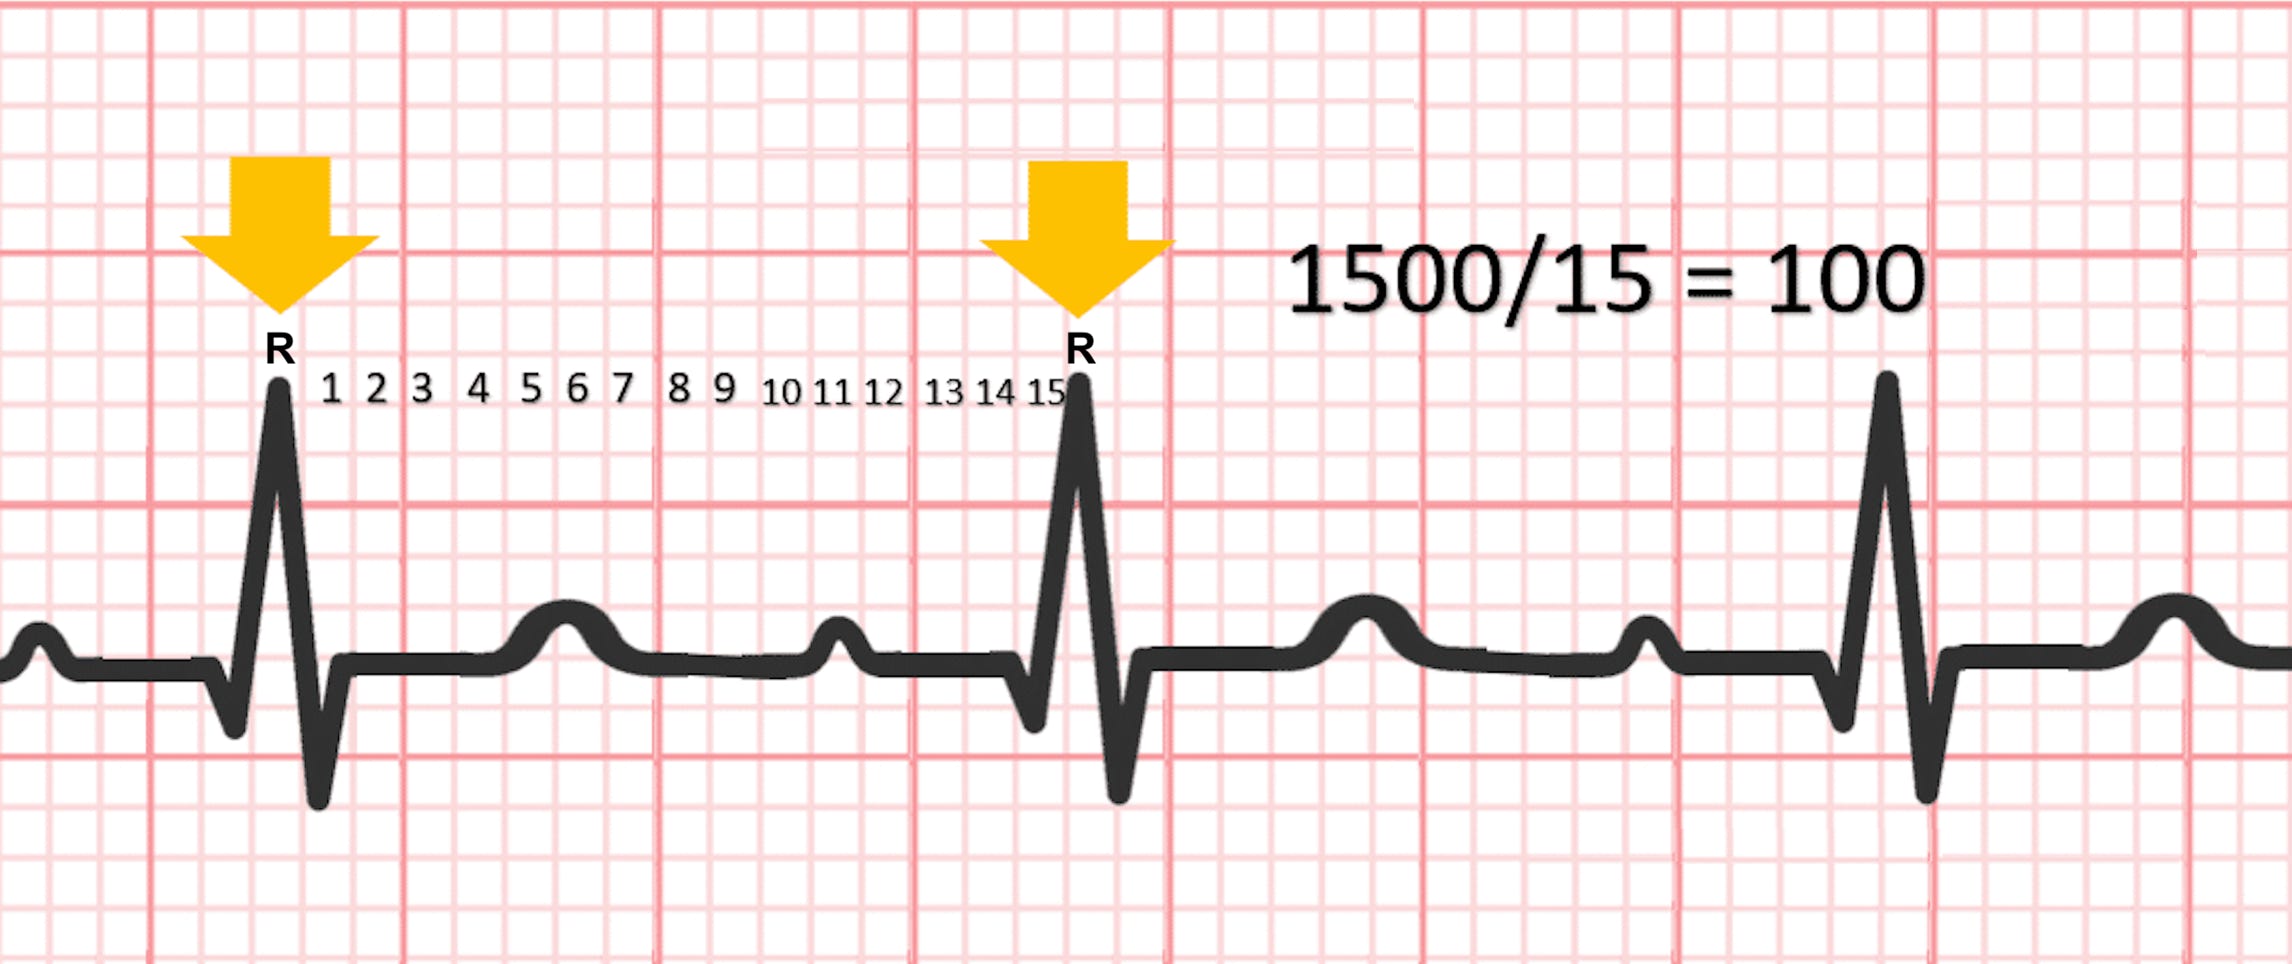
The 1500 method:
Calculate the heart rate using the 1500 method by counting the number of small boxes between the R-R interval, then dividing 1,500by that number.
For example, if there are 15 small boxes between two R waves (R-R interval), the heart rate equals 1500/15, or 100/min.
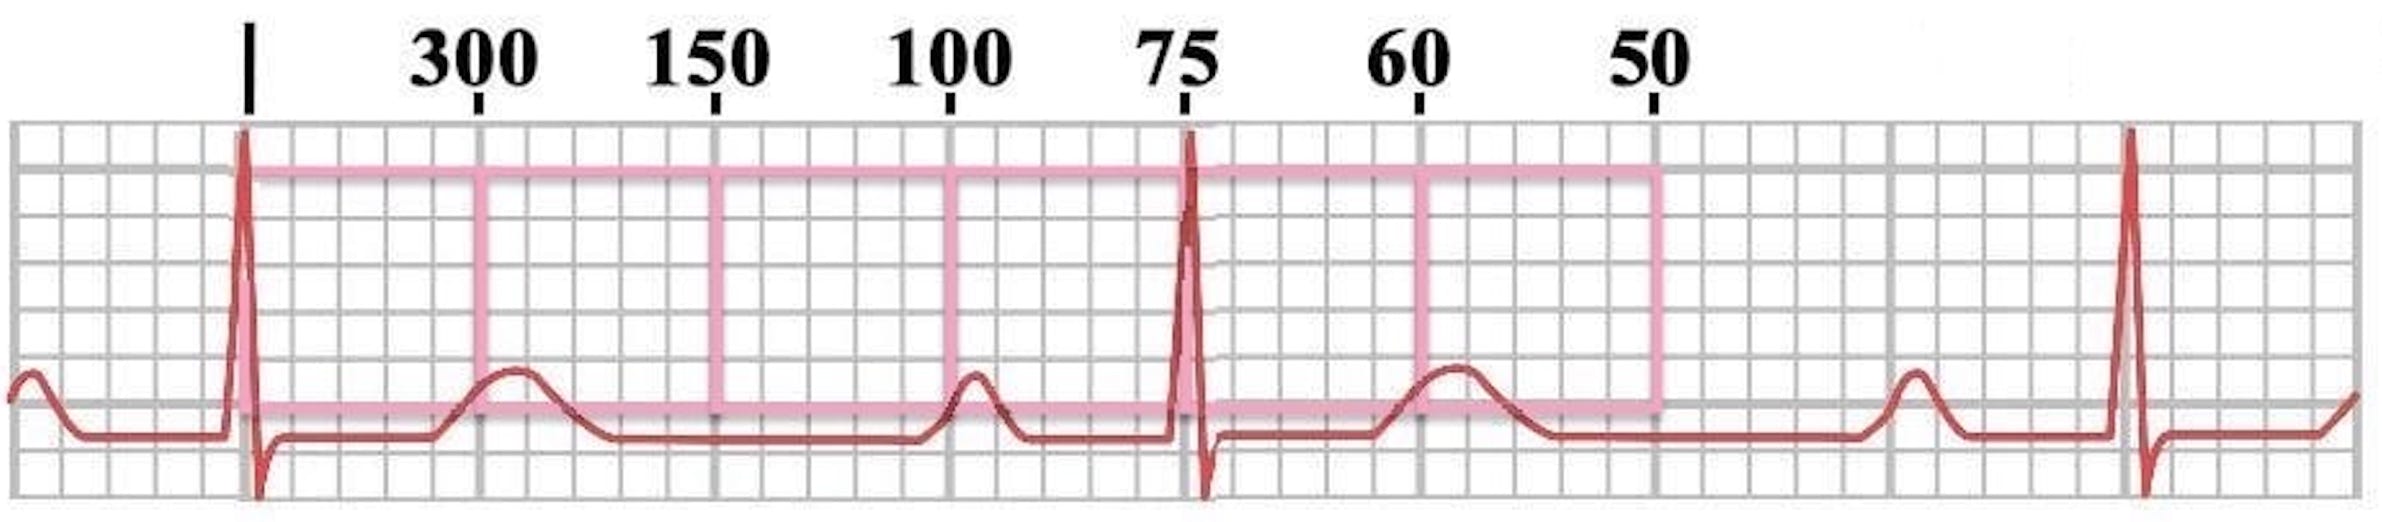
Sequence or 300 method:
The sequence method (also known as the 300 method) is derived
from the 1500 method.
There are 300 large, 5 mm boxes in every minute of EKG tracing at the normal 25mm/second print speed.
Remember the pattern 300-150-100-75-60-50.
Calculate these numbers by dividing 300 by the number of large boxes between QRS complexes.
Find an R wave and start counting away from it moving towards the right of the tracing in 5 mm segments (one large box).
With every move, apply the number in the pattern you memorized. This is a wonderful rule to apply most of the time, with one exception: it cannot be used in irregular rhythms.